How Does the US Healthcare System Compare to Other Countries?
The US spends more on health care than any other country, and most comparisons stop right there. The latest data tells a fuller story: Americans are living longer than ever, five-year cancer survival has reached 70%, US hospitals post lower 30-day death rates after a heart attack or stroke than the OECD average, and most new drugs are approved in the US first. This guide walks through those strengths, then looks honestly at the one trade-off that sits behind them: cost.
How the US system works, in 60 seconds
The US does not run a single national insurance scheme. It runs a mix: employer-sponsored and individual private plans, plus public programs, chiefly Medicare (people 65 and older and some people with disabilities) and Medicaid (lower-income households). In 2024, national health spending reached $5.3 trillion and 91.8% of residents had health insurance, according to CMS National Health Expenditure data.
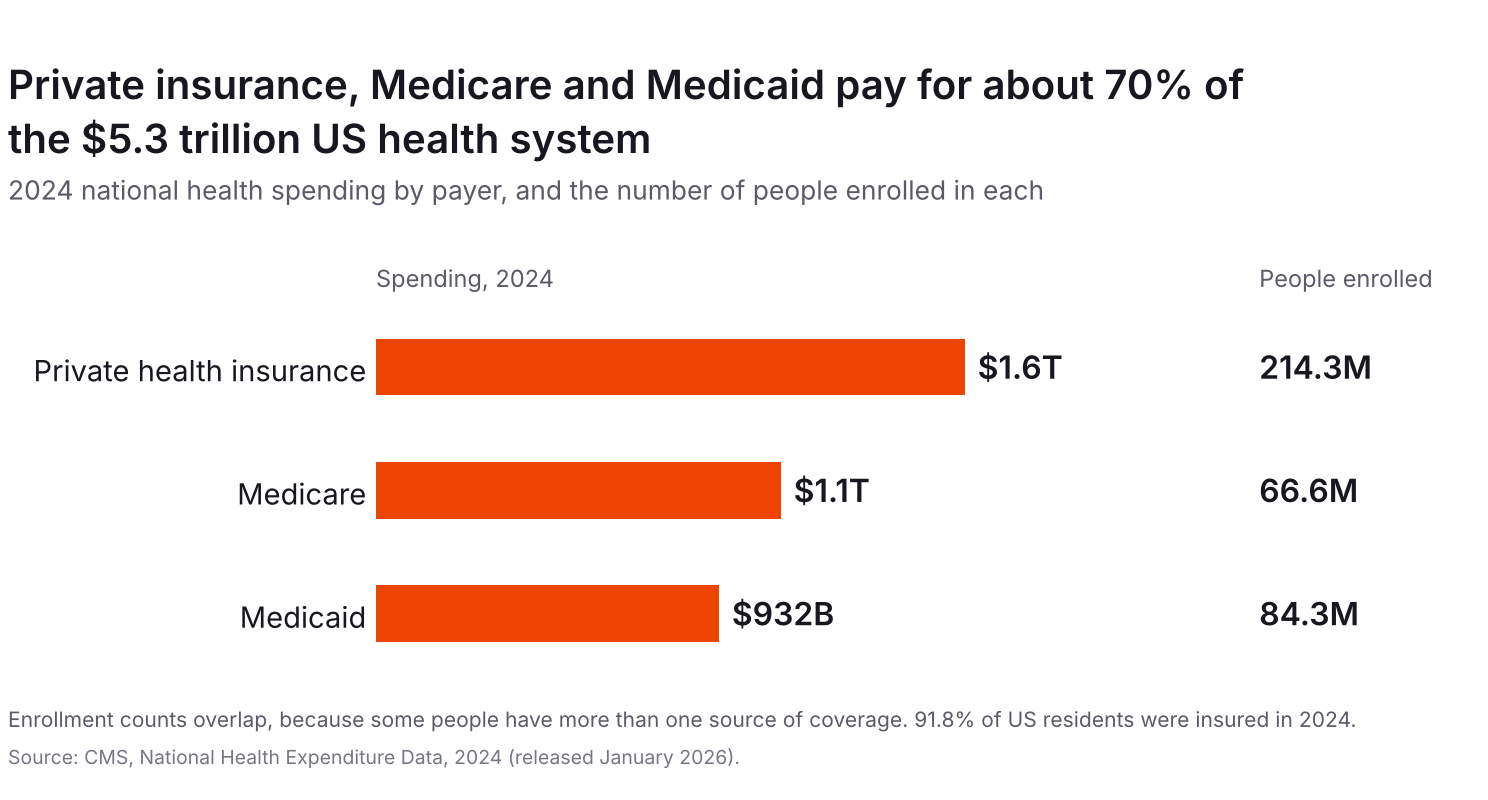
Private health insurance was the largest payer at about $1.6 trillion. Medicare spent $1.1 trillion for 66.6 million enrollees, and Medicaid $932 billion for 84.3 million. Hospital care ($1.6 trillion), physician and clinical services ($1.1 trillion) and retail prescription drugs ($467 billion) were the three biggest spending categories. By source of funds, the federal government accounted for 31% of spending, households 28%, private business 18% and state and local governments 16%, per the CMS fact sheet.
Americans are living longer than ever
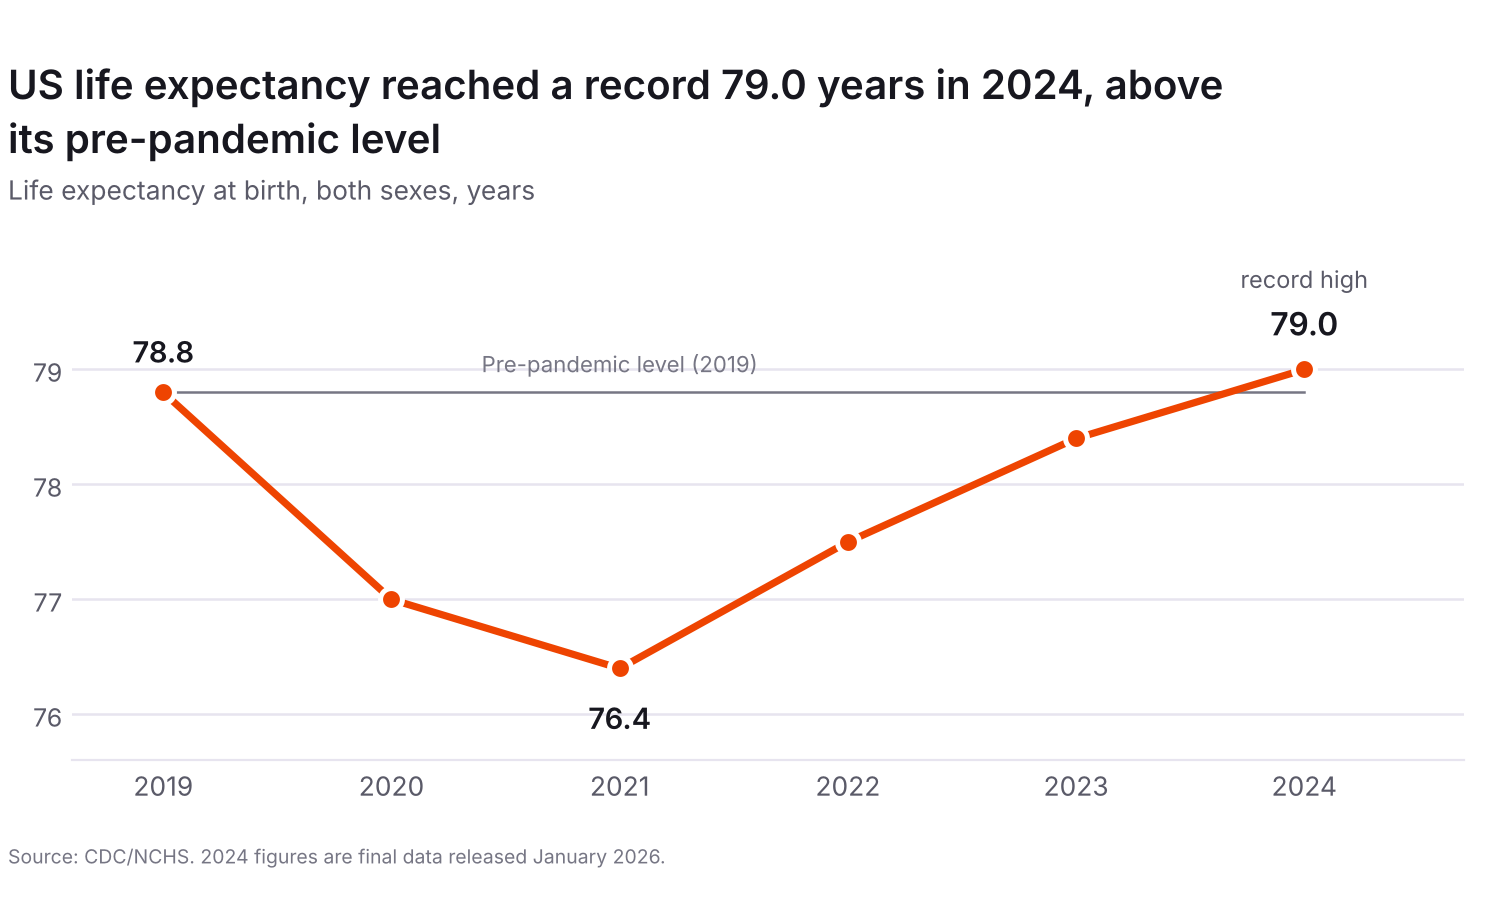
US life expectancy reached a record 79.0 years in 2024, up 0.6 years from 78.4 in 2023, according to final CDC data. That is above the pre-pandemic level of 78.8 in 2019, and the age-adjusted death rate fell 3.8% in a single year.
The gains are continuing. Provisional CDC figures put the 2025 age-adjusted death rate at 689.2 per 100,000, down 4.6% from 2024 and the lowest on record. Drug overdose deaths fell 26.2% in 2024, from 31.3 to 23.1 per 100,000 according to a separate CDC data brief, and COVID-19 dropped out of the top ten causes of death.
Seven in ten people with cancer are alive five years later
Of people diagnosed with cancer in 2016 to 2022, 70.5% were alive five years later, according to the National Cancer Institute's SEER program. That is a relative survival rate, which compares patients with the general population of the same age.
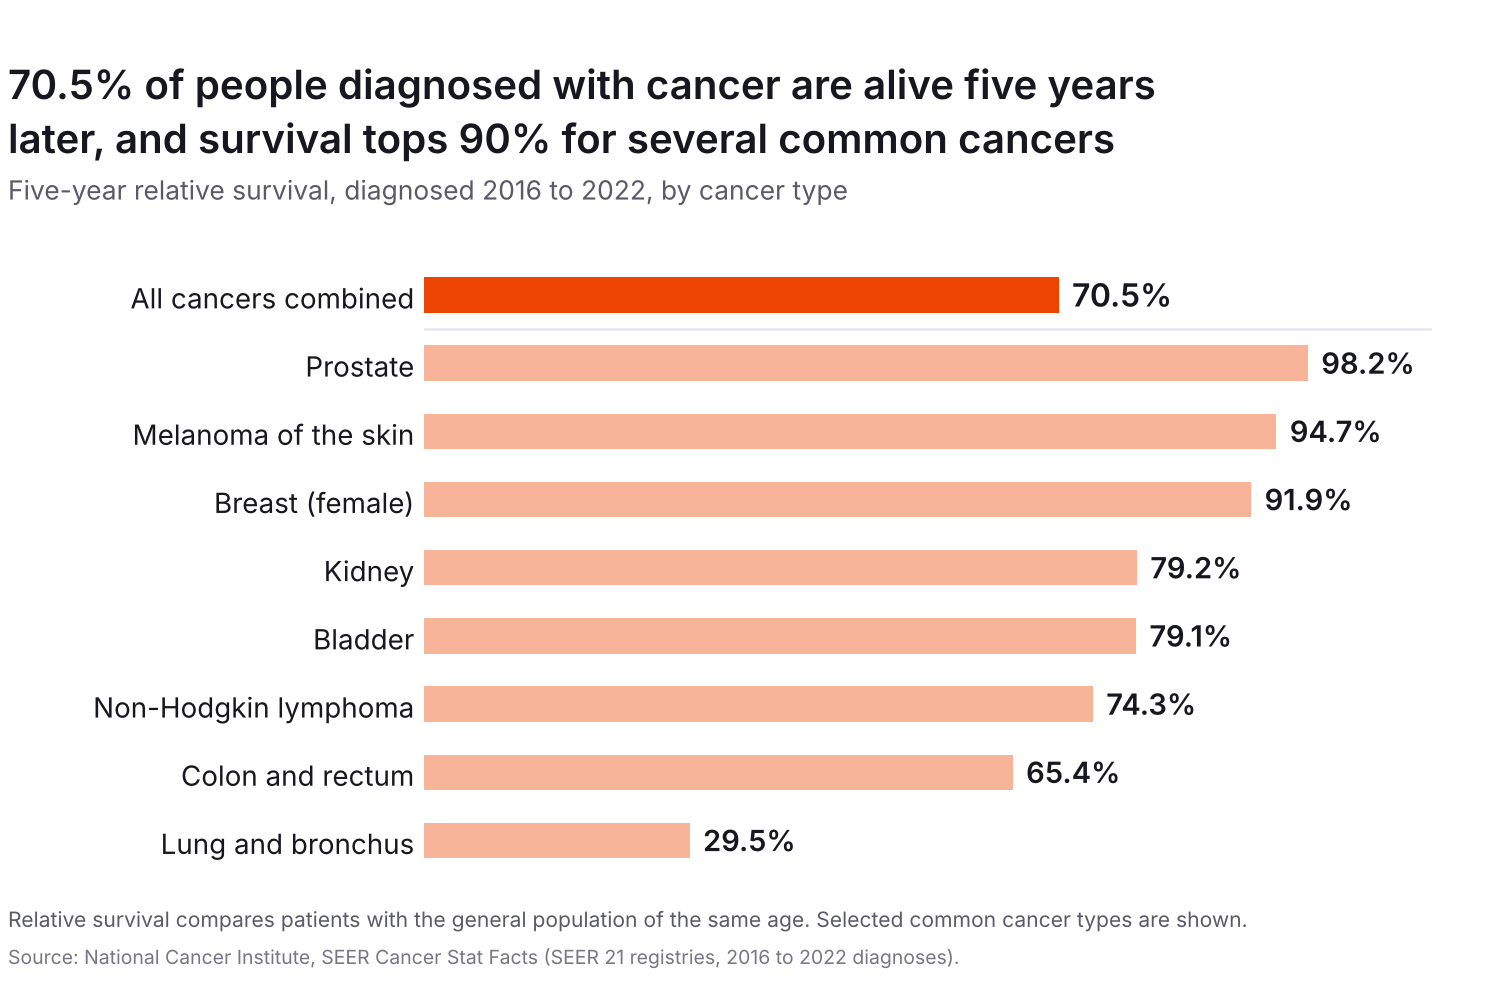
Survival varies widely by cancer type. Five-year survival is 98.2% for prostate cancer, 94.7% for melanoma of the skin and 91.9% for breast cancer, and above 79% for kidney and bladder cancers, per SEER's common cancer sites table. Lung cancer, at 29.5%, is the one on this list where outcomes remain much lower.
When a heart attack or stroke hits, US hospitals deliver
In the OECD's Health at a Glance 2025, 5.2% of US patients admitted for a heart attack died within 30 days, compared with an OECD average of 6.5%. For ischemic stroke the figures are 4.5% in the US and 7.7% on average. Time is everything in both conditions, and both are standard OECD indicators of acute care quality, although the OECD notes they also reflect pre-hospital care such as ambulance response.
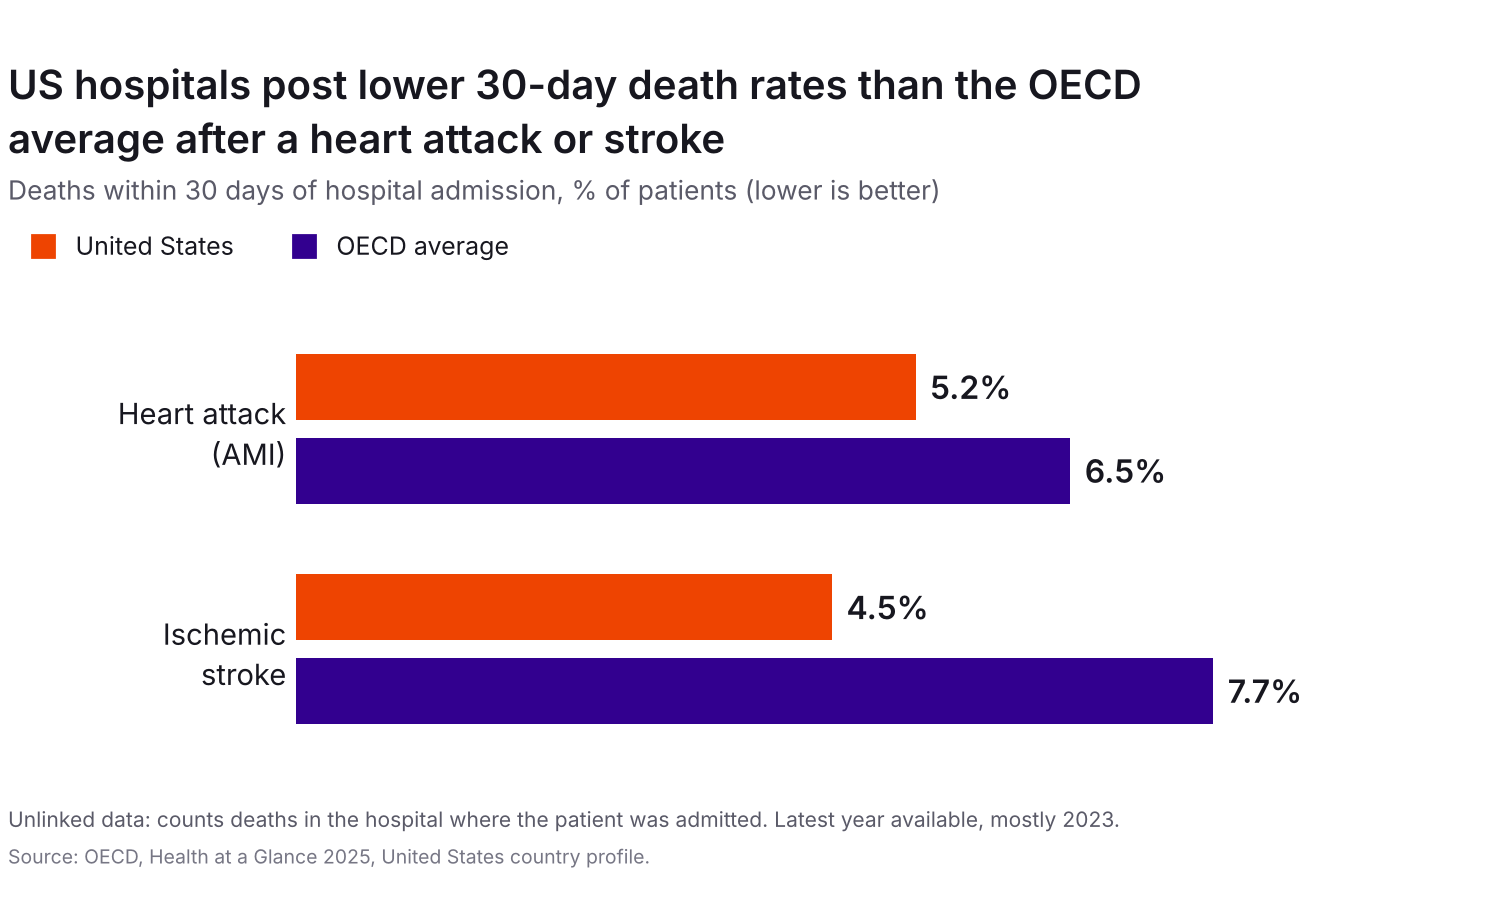
A note on method: these are "unlinked" measures, which count deaths in the same hospital where the patient was first admitted. The OECD also publishes a "linked" version that follows patients across hospitals, which not every country can produce.
More scanners, more nurses, fewer smokers
The OECD's US country profile shows real depth in the resources used to deliver care. The US has 86 CT, MRI and PET units per million people, against an OECD average of 51, and 12.4 nurses per 1,000 people, against 9.2. Americans are also more satisfied with access to quality care where they live: 75% say they are satisfied with its availability, compared with 64% across the OECD.
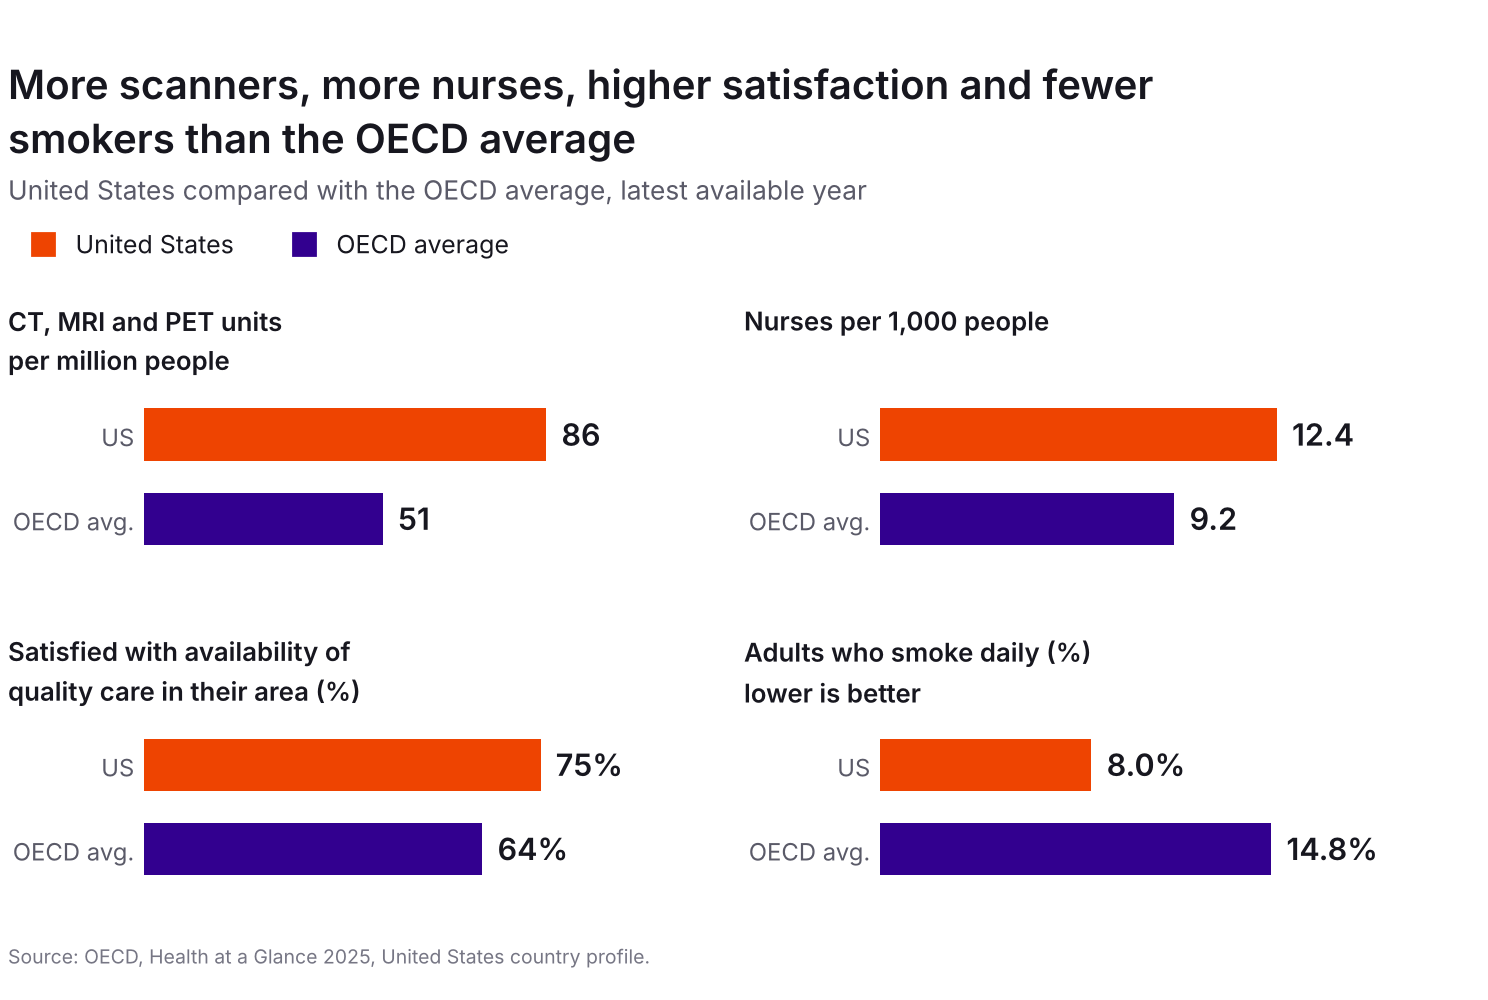
Daily smoking, a major driver of preventable disease, is also much lower: 8.0% of US adults smoke daily, against an OECD average of 14.8%.
Most new drugs are approved in the US first
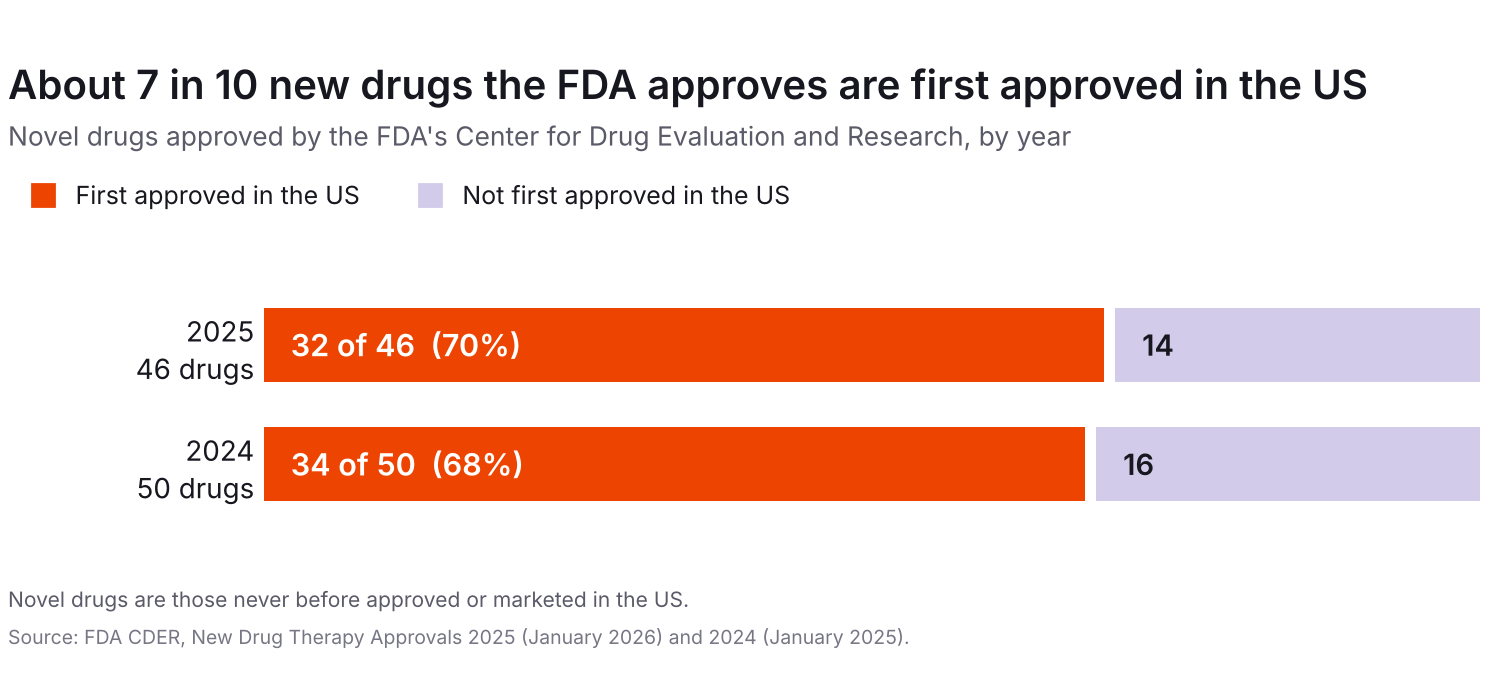
The FDA's annual reports on novel drug approvals show the US is usually where new drugs are approved first. In 2025, 32 of the 46 novel drugs approved by the FDA's Center for Drug Evaluation and Research (70%) were first approved in the US. In 2024 the figure was 34 of 50 (68%). 2026 is running ahead of that pace: as of October 20, the same FDA center had already approved 47 novel drugs this year, more than the 46 it approved in all of 2025.
The price tag: the one real trade-off
All of this costs far more than the OECD average. The OECD puts US health spending at $14,885 per person (adjusted for price differences), against an OECD average of $5,967, and at 17.2% of GDP against 9.3% on the OECD's definitions.
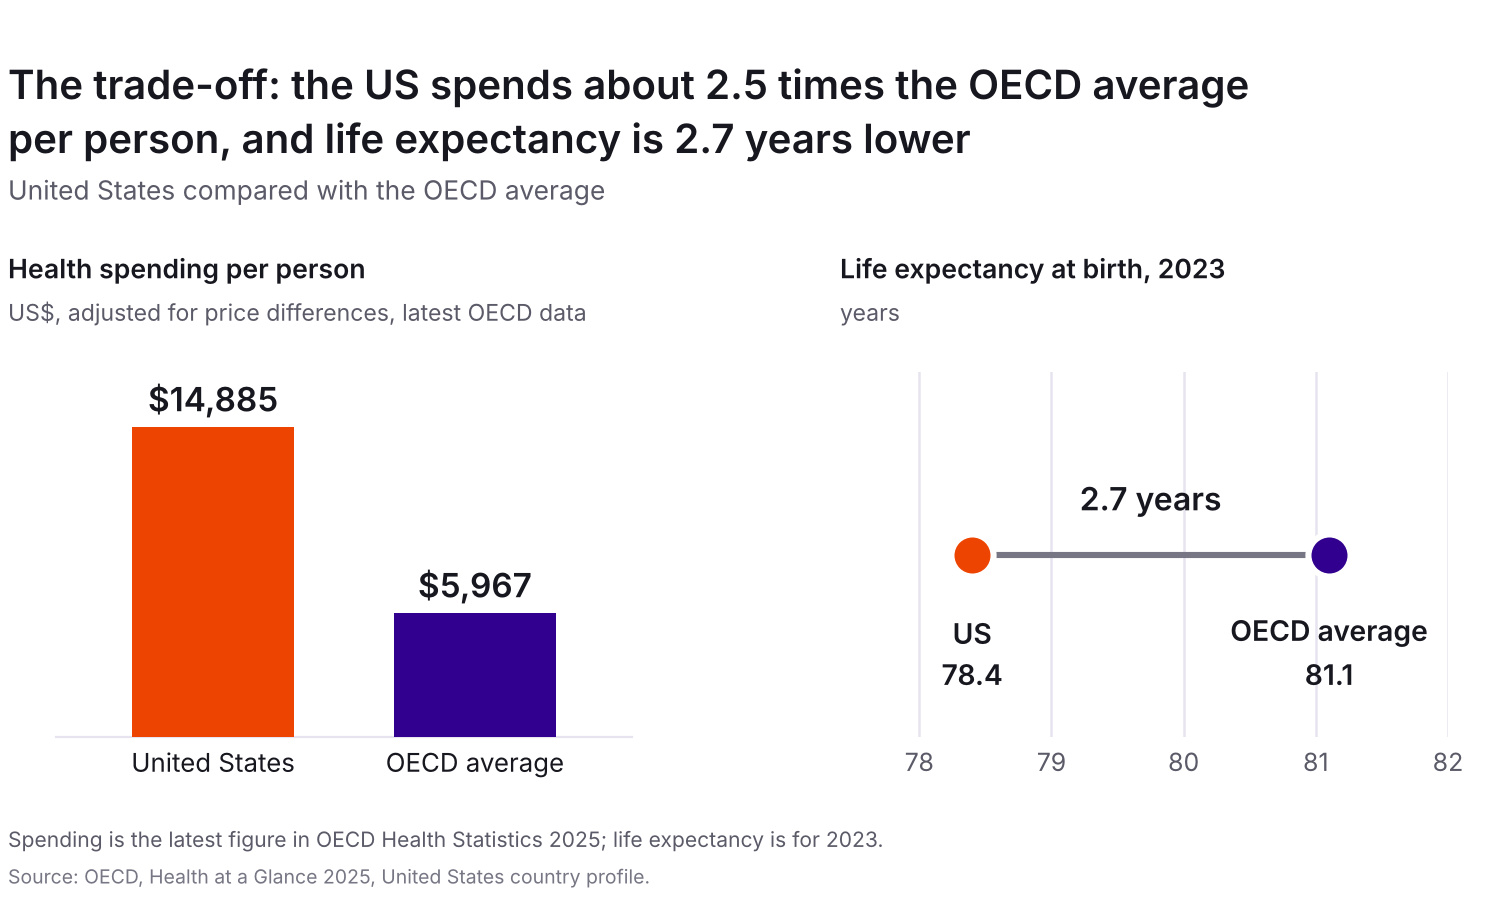
Spending has not bought the longest lives. According to the OECD, US life expectancy was 78.4 years in 2023, 2.7 years below the OECD average of 81.1. And CMS actuaries project national health spending to reach $9.0 trillion by 2034, or 20.6% of GDP.
None of this erases the strengths above. It is the other side of the same ledger, and the open question for policymakers, employers and health companies is how to keep the outcomes and the innovation while improving the value of each dollar.
The bottom line
The latest data shows a system with real strengths: record life expectancy, cancer survival of 70%, lower 30-day death rates than the OECD average after a heart attack or stroke, deep imaging and nursing capacity, and first US approval for most new drugs. It also spends about 2.5 times the OECD average per person, and that is where the comparison with peers gets harder. Judging the US system fairly means holding both facts at once.
Intent.Health is a healthcare commercial intelligence platform. To see what this looks like in your own market, talk to our team.
FAQs
How much does the US spend on health care?
About $5.3 trillion in 2024, or $15,474 per person and 18.0% of GDP, according to CMS. That is up 7.2% from 2023.
How many Americans have health insurance?
About 91.8% of US residents were insured in 2024, per CMS. Private insurance has the most enrollees (214.3 million), followed by Medicaid (84.3 million) and Medicare (66.6 million). Some people have more than one source of coverage.
Who pays for health care in the US?
A mix of private insurance and public programs. In 2024, private health insurance spent about $1.6 trillion, Medicare $1.1 trillion and Medicaid $932 billion. By source of funds, the federal government accounted for 31% of spending, households 28%, private business 18% and state and local governments 16%, per the CMS fact sheet.
Are Americans living longer?
Yes. Life expectancy hit a record 79.0 years in 2024, up from 78.4 in 2023 and above the pre-pandemic 78.8 in 2019, according to CDC. Provisional data also show a record-low death rate in 2025.
What share of cancer patients survive five years?
About 70.5% of people diagnosed in 2016 to 2022 were alive five years later, per the National Cancer Institute's SEER program. For example, it is 98.2% for prostate cancer and 29.5% for lung cancer.
How do US hospitals do on heart attacks and strokes?
Better than the OECD average on 30-day death rates: 5.2% versus 6.5% for heart attacks and 4.5% versus 7.7% for ischemic strokes, per the OECD. These count deaths in the admitting hospital only, so read them as a measure of hospital care, not the whole outcome picture.
Are new drugs usually approved in the US first?
Mostly, yes. The FDA reports that 32 of the 46 novel drugs it approved in 2025 (70%) and 34 of the 50 approved in 2024 (68%) were first approved in the US.
Is the US healthcare system the best in the world?
It depends on what you measure. US hospitals post lower 30-day death rates than the OECD average after a heart attack or stroke, and the US has more scanners and nurses per person, per the OECD. Cost is the main trade-off: US health spending is about 2.5 times the OECD average per person, and US life expectancy is 2.7 years below the OECD average.
Sources
- CMS: National Health Expenditure Data, historical (2024), the NHE fact sheet, the 2024 NHE infographic and projections, 2025 to 2034
- CDC/NCHS: Mortality in the United States, 2024 (Data Brief 548), provisional 2025 death rate, drug overdose deaths (Data Brief 549), life expectancy 2019 to 2022 (MMWR QuickStats) and 2020 to 2021 values
- National Cancer Institute: SEER Cancer Stat Facts, all cancer sites and common cancer sites
- FDA: New Drug Therapy Approvals 2025, New Drug Therapy Approvals 2024 and Novel Drug Approvals for 2026
- OECD: Health at a Glance 2025, United States country profile and mortality following acute myocardial infarction