
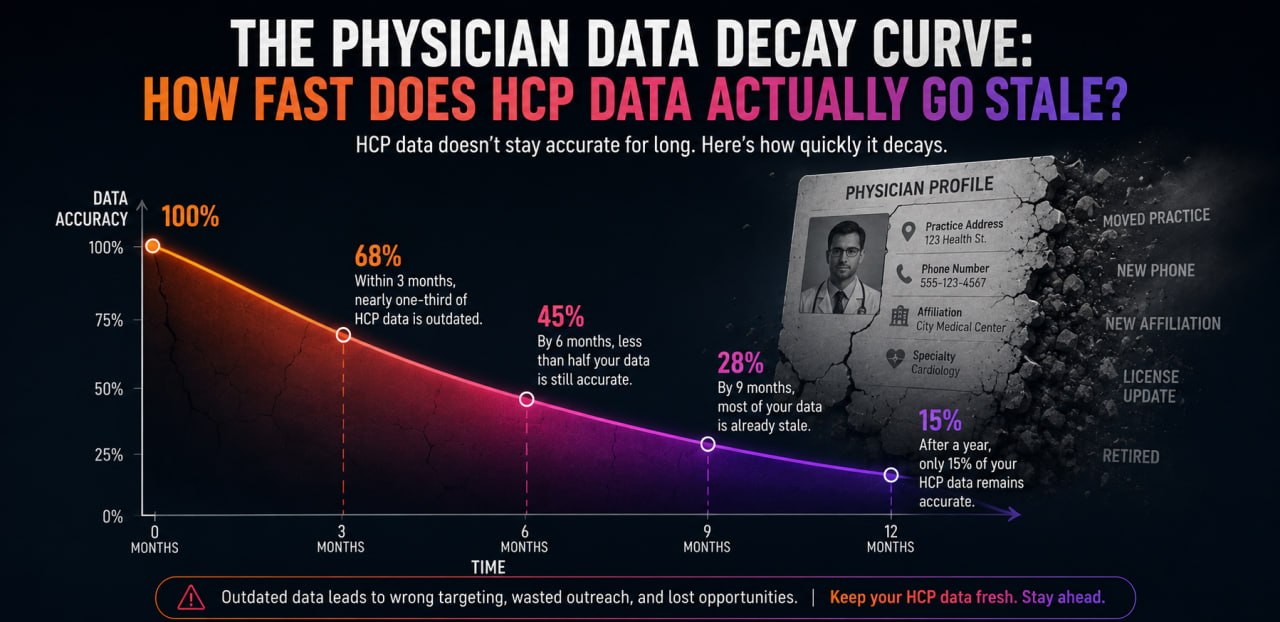
The honest answer, backed by the research: faster than the single-year number sounds, and faster than any one statistic fully captures.
Ask ten commercial teams how quickly physician data goes stale, and most will guess a small number, something like "a few percent a year." They're not wrong about the number. They're just not seeing the whole curve.
The number: how fast physicians actually turn over
A national study published in the Annals of Internal Medicine, tracking physicians billing Traditional Medicare, found that annual physician turnover, meaning a physician either moved to a new practice or stopped practicing altogether, rose from 5.3% in 2010 to 7.6% by 2018. A separate, more recent nationwide study of over 700,000 physicians found a similar trend specifically among physicians leaving clinical practice entirely, climbing from 3.5% to 4.9% between 2013 and 2019.
Roughly one in thirteen physicians, every year, either changes practices or stops practicing in a way that makes their old record wrong.
That sounds manageable. It isn't, once you let it run.
Why a small number compounds fast
Here's what happens if you apply that 7.6% figure to a database and simply never touch it again:
| Years since last full validation | Share of records still accurate |
|---|---|
| Year 0 | 100% |
| Year 1 | 92.4% |
| Year 2 | 85.4% |
| Year 3 | 78.9% |
| Year 4 | 72.9% |
| Year 5 | 67.4% |
This works the same way compound interest does, just in reverse. Each year's decay applies to a shrinking pool of records that were still accurate, so the losses compound rather than simply adding up year over year. That's why 7.6% doesn't sound dramatic as a single-year figure, but left unchecked for five years, it quietly erodes almost a third of the database, exactly the kind of number that shows up in an audit and surprises everyone.
Check My Data Free →Turnover is only one part of the curve
The table above is the optimistic version, because physician turnover isn't the only thing aging a database.
Practices merge, get acquired, or rebrand without any individual physician "leaving" anything. According to AMA benchmark survey data, the share of physicians working in private practice fell from 60.1% in 2012 to 42.2% by 2024, a structural shift toward hospital and health-system employment that quietly invalidates affiliation data even when the physician themselves hasn't moved an inch. Add in address changes that happen without a full practice change, and NPIs that go inactive for administrative reasons unrelated to whether someone is still practicing, and you get several overlapping decay curves stacking on top of each other, not one clean line.
That stacking effect is likely why a real audit of 40,000 physician records found that over half needed some form of correction, a far higher share than the turnover curve alone would predict. Turnover explains part of the erosion. Affiliation drift, address drift, and NPI churn explain the rest.
How this compares to data decay outside healthcare
For context: general B2B contact databases, across all industries, are commonly cited as decaying somewhere between 22% and 30% a year, a figure that traces back to MarketingSherpa research and has been repeated widely across the sales and marketing industry. On the surface, physician turnover alone looks far more stable than that.
But the comparison flatters healthcare data more than it should. A generic B2B contact record has one real point of failure: the person's job. A physician record has several, layered on top of each other: the physician, their practice's ownership structure, their listed affiliation, and their NPI status, each capable of going stale independently, on its own schedule. Lower turnover on one axis doesn't mean lower decay overall when three or four axes are moving at once.
How often should you actually check?
There's no universal answer, because the honest one depends on how long it's been since your specific database was last validated. But the math above gives a useful floor: if turnover alone erodes a database by roughly 7 to 8 percent a year, and real-world decay runs meaningfully higher once affiliation, address, and NPI churn stack on top, a once-a-year refresh guarantees you're campaigning against materially stale data for most of the year, every year, by design.
Quarterly checks cut that exposure to roughly a quarter of the annual number at any given moment. Continuous validation removes most of it, because there's no longer a fixed window in which decay is allowed to quietly accumulate before anyone looks again.
One honest caveat: these are national averages. Actual turnover varies by specialty, geography, and practice type, so your own database's curve might be steeper or gentler than these numbers suggest. The only way to know your real curve is to measure it directly.
Check My Data Free →